
Search
Leave a Message
Thank you for your message. We will be in touch with you shortly.
Explore Our Properties
Furnished living room with a white sofa, two armchairs, and large windows with sheer curtains.

What's Does Your Neighborhood Insight Look Like For Q3?

10 years of historical performance of condominium and single-family closings by quarter.
Sarah Jackson  |  November 5, 2018

Q3 2018 Los Angeles Quarterly Market Insights Report

The below charts below highlight 10 years of historical performance of condominium and single-family closings by quarter. Please note all data below is as of 9/15/2018.
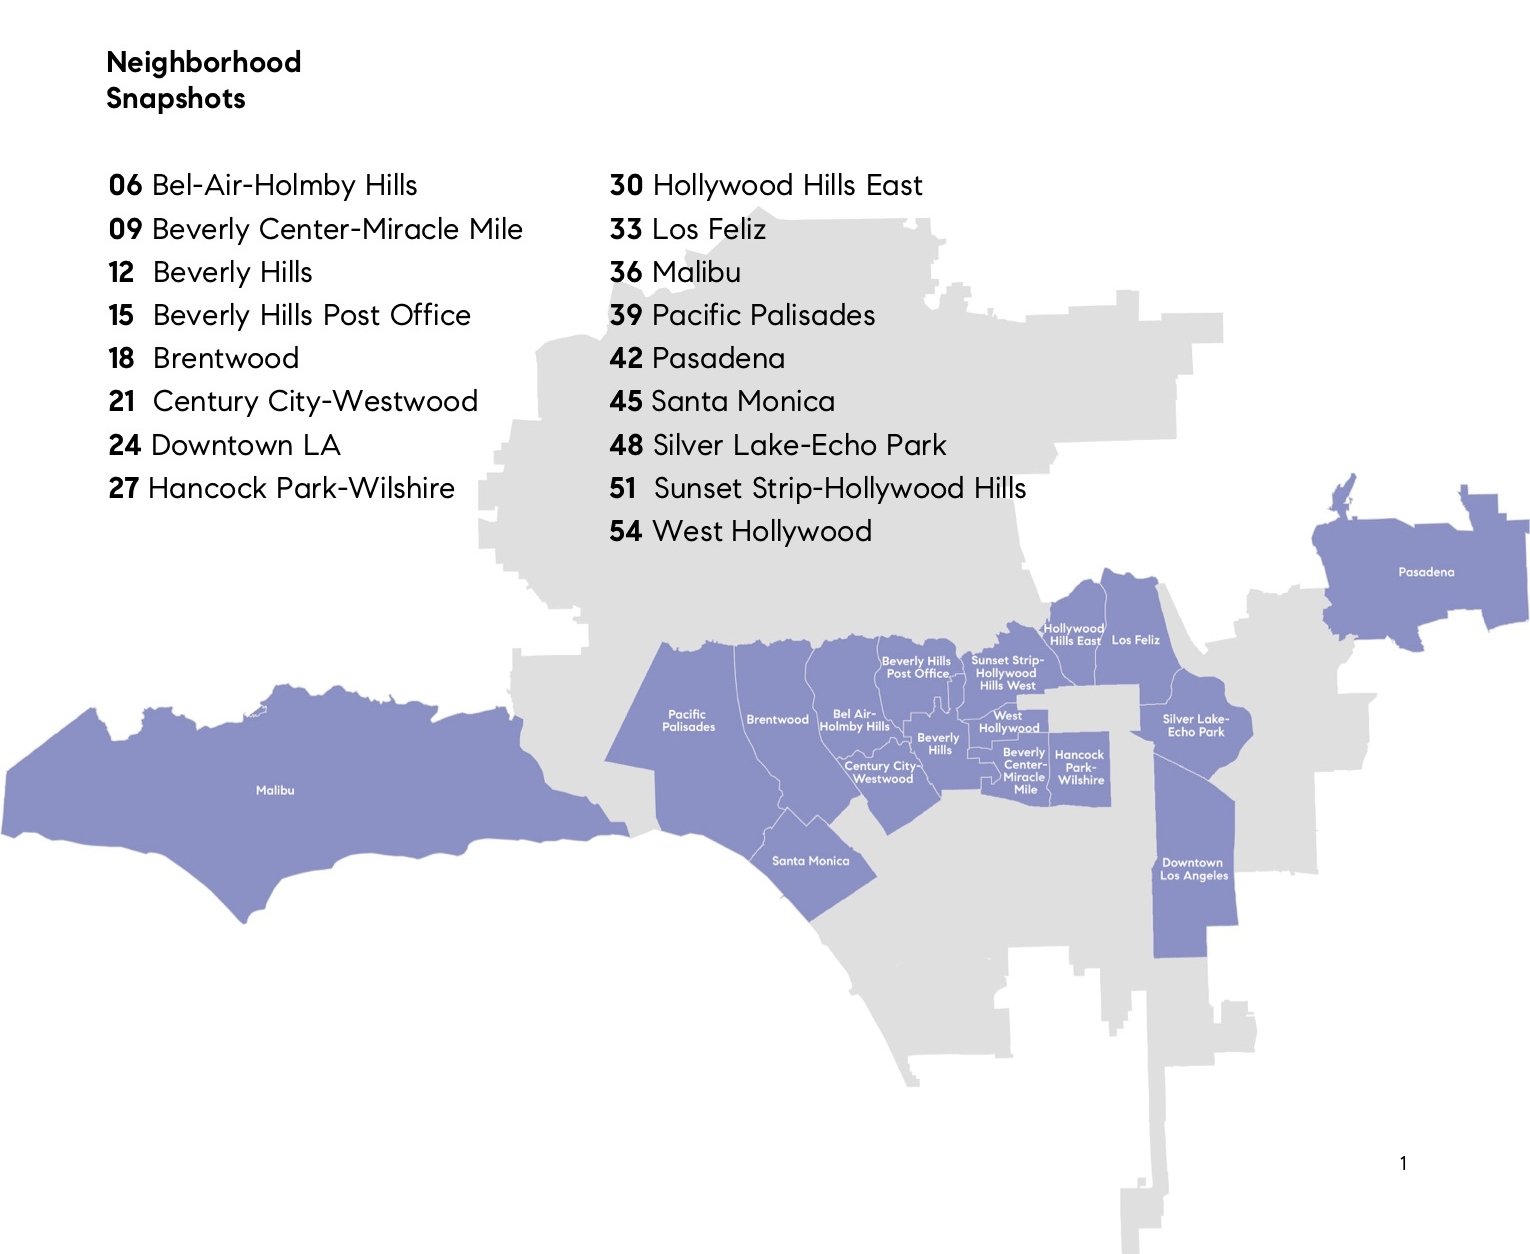
 
Map highlighting Los Angeles neighborhoods, including Malibu, Beverly Hills, Santa Monica, and Pasadena, alongside a numbered index.
 
Click to Download Neighborhood Reports
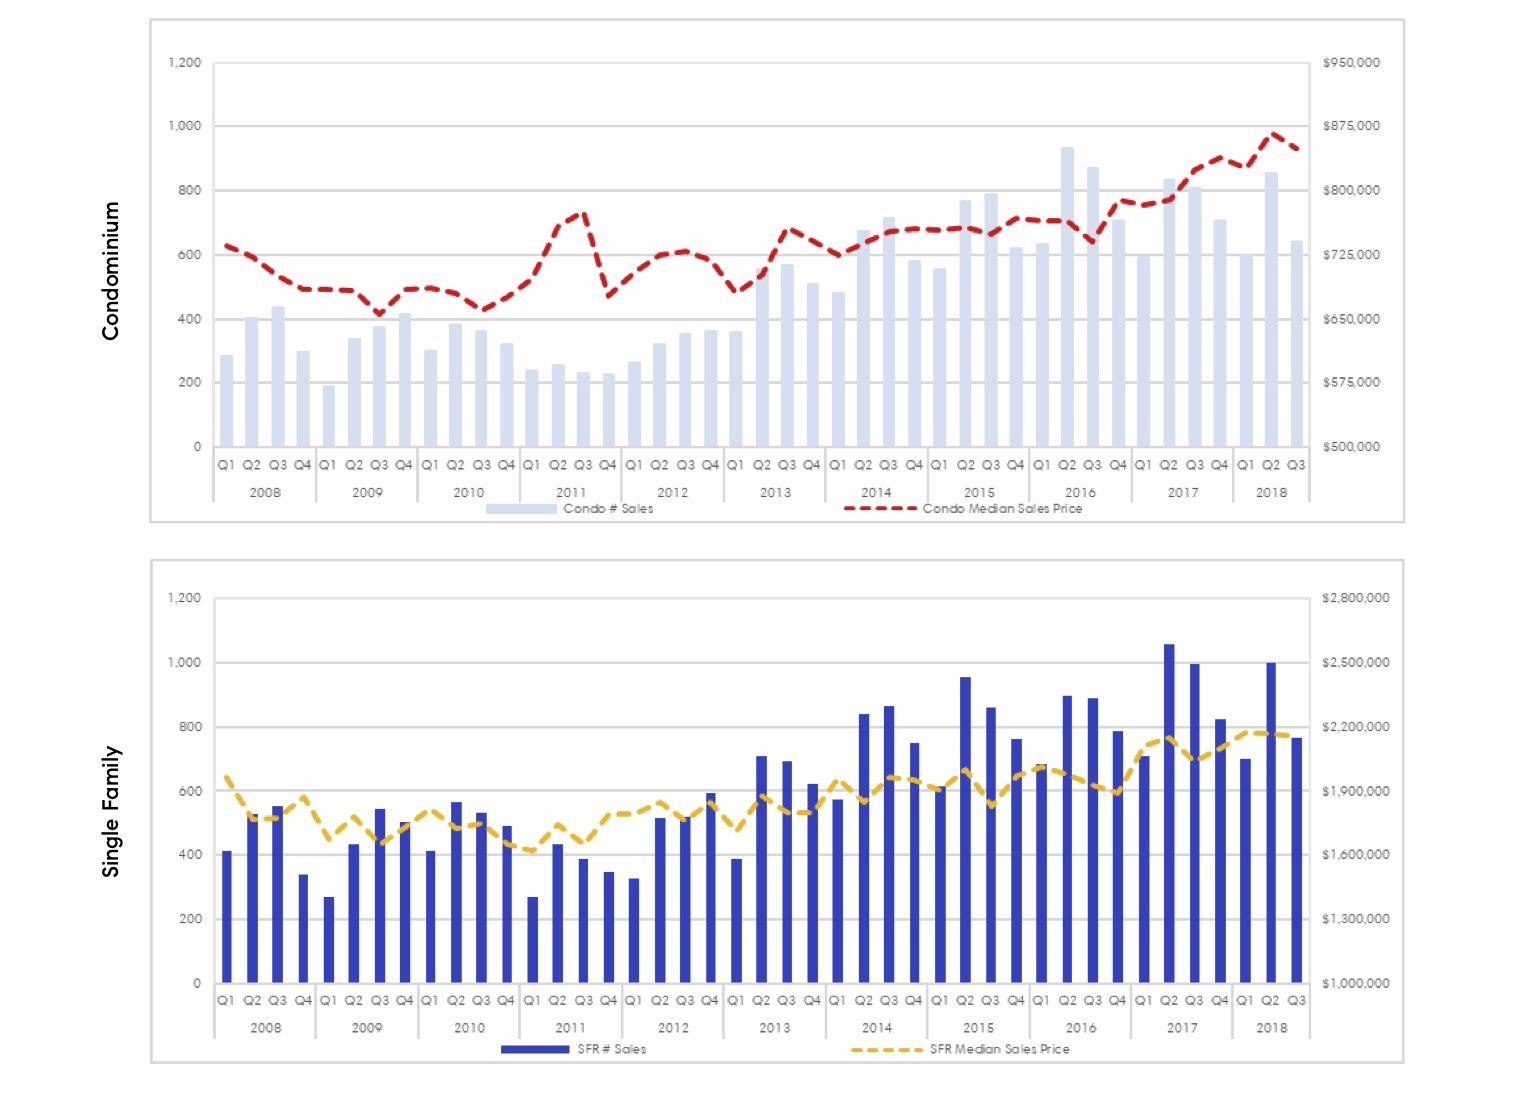
 
Quarterly condominium and single-family sales counts and median prices, 2008–Q3 2018.
 
Source: Compass